Data Viewer Introduction and Guide to Use
Updated for v2.6, June. 2025
Table of Contents: Data Viewer Overview Understanding Key Aspects of the Data Viewer Useful Tools and Features in the Data Viewer Appendix I: Full Feature List and Notes Appendix II - Region Definitions
Data Viewer Overview
These tools complement the Capabilities Model with interactive data visualizations to explore the Community Dataset provided by institutions that are using and/or have completed assessments using the Model. The Model was developed to identify the variety of relevant approaches taken to support Research Computing and Data (RCD) and the key factors for providing that support. The Model is designed for use as an input to strategic decision making and is intended to be inclusive across a broad range of institutions.
The Data Viewer includes three types of views of the Community Dataset:
- Community Demographics provides graphical displays of information about the institutions in the dataset, from map views to charts to a scatter graph summary of the data. A set of view controls and filters allow users to customize the visualizations on a segment within the broader community. There is also a list of the contributing institutions by name.
- Capabilities Data and Benchmarking provides graphical displays of Capabilities Model Assessment Data in the Community Dataset, and the ability to benchmark assessment results relative to others in the Community Dataset.
- Priorities Data (coming in a future release) will provide information about the areas of capabilities that institutions marked as a priority for attention when they completed their assessment.
Who can use the Data Viewer?
This tool is for anyone who wants to understand the state of
Research Computing and Data support
across the community
and explore aspects of that by topic, region, types of institutions, etc.
The Data Viewer is designed to be useful to a diverse mix of stakeholders, including campus research computing and data practitioners, the researchers and educators they work with, as well as key partners (e.g., central IT), and campus leadership. Users who are unfamiliar with the CaRCC Capabilities Model may wish to review the associated Introduction and Guide to Use.
What are common uses for the Data Viewer?
- To explore the areas of strength and weakness in RCD support across the broader community of contributing institutions.
- To benchmark an institution’s assessed RCD support relative to the community, or to a set of chosen peers (current or aspirational).
- To understand the mix of institutions that are using the Model, and those that have completed and contributed an assessment.
Acknowledgements
The CaRCC Capabilities Model was developed through a collaboration of the Campus Research Computing Consortium (CaRCC), Internet2, and EDUCAUSE. This work has been supported in part by the National Science Foundation via OAC-1620695 and OAC-2100003.
Copyright ©2023-2026 Internet2 and CaRCC, and licensed for use under Creative Commons Attribution-NoDerivatives 4.0 International (CC BY-ND 4.0) which grants usage to the general public and rights to share and redistribute for any purpose, even commercially; you must give appropriate credit with a link to the license, and if you remix, transform, or build upon the materials in any way, you may not distribute the modified material.
Understanding Key Aspects of the Data Viewer
The data includes self-reported capabilities across a range of different topics presented in the Model[1]. In addition, we have metadata about the institutions themselves that is used both to visualize the community of users, and to support filtering of the Community Dataset.
The key concepts that structure the data are:
Institutional Metadata
We have metadata about the institutions that are using the Model that we draw from the Department of Education’s IPEDS data[2], from the Carnegie Classification[3], and from data that users provide when they create an institution profile to use the Model. The metadata values are used to provide different comparative views of the data and to filter the data to understand or benchmark a particular subset of institutions.
Institutional Classification: Values are based upon the widely used Carnegie Classification with adjustments and extensions to support our community of users (e.g., to include additional types of institutions and those that are not U.S. Higher Education institutions).
Institutional Mission: this is a simpler classification that allows for grouping and comparison of institutions by their core mission (the balance of research and teaching)[4]. Note that the dataset does not include this value for all institutions, however we are working to expand coverage to as many as possible. Values include:
Research Essential: Research is the primary or exclusive mission, and teaching does not significantly factor into faculty and institutional success (Research Labs, National Supercomputing Centers, etc.).
Research Favored: Research and teaching are the primary missions, but research is what really drives faculty and institutional success (e.g., Research-driven Universities).
Balanced: Research and teaching are both primary missions, and they are equally important for faculty and institutional success.
Teaching Favored: Teaching is the primary mission, but faculty research is rewarded.
Teaching Essential: Teaching is the primary mission, and faculty research does not factor heavily in faculty and institutional success.
Public/Private: (a.k.a. “Control” of the institution). Note that we can accommodate private for-profit institutions, but few such institutions are participating to date.
EPSCoR Status: for higher education institutions in EPSCoR jurisdictions, as defined by the National Science Foundation (NSF)[5].
Minority-Serving Status: drawn from the US Department of Education Eligibility Matrix[6].
Region: The geographic region in which the institution is located. For a list of the regions and which states/provinces each includes, see Appendix II.
Size: The total number of students (graduate and undergraduate) as reported in the IPEDS dataset. Values are ranges (also defined by IPEDS).
Research Expenditures: The total US dollar value of research expenditures as reported by IPEDS; the most recent dataset we are using (as of 2024) includes values reported in the IPEDS survey for 2022. Caveat Lector: these reported values may be out of date and/or may differ from what institutions currently report (e.g., on their website).
Organizational Model: data provided by users when they create an institution profile. Users choose the option that best describes how their institution's RCD services and staff are organized. Values include:
Centralized: Primarily within a central RCD/HPC group.
In a School/Dept.: Embedded within a single department or school.
Decentralized across units: Decentralized collaboration among several departments, schools, etc.
No organized support: No organized RCD support program currently exists.
Reporting Structure: data provided by users when they create an institution profile. Users choose the option that best describes where within the institution their RCD program ultimately reports. Values include:
Information Technology, e.g., the Chief Information Officer (CIO)
Research, e.g., a Vice Provost for Research (VPR)
Academic Leadership (e.g., the Provost or a Dean)
Academic/Research Institute or Center
Other (not otherwise specified)
Institutional Populations
There are two populations represented in the data view graphs:
- All Users: This includes all institutions that have created an institution profile on the RCD Nexus portal, and/or that requested and downloaded an earlier version of the Capabilities Model.
- Contributors: This includes only those institutions that have completed an assessment using the CaRCC Capabilities Model and submitted their data to the Community Dataset.
For the Community Demographics visualizations, users can select which population they are interested in using the Population filter choices. The Capabilities Data and Benchmarking and Priorities Data visualizations are (of course) drawn only from Contributors.
Note that for institutions that have completed and contributed more than one assessment (i.e., who have repeated the process in more than one year), the Community Dataset only uses the most recent assessment data for that institution. Users at these institutions can see benchmarking results for the three most recent assessments.
The Five Facings
The Model is organized into sections that reflect different roles that staff fill in supporting Research Computing and Data, and are named to reflect who or what each role is "facing" (i.e., focused on).[7] Within each facing, the model includes capabilities covering aspects of research computing and data for the associated role; the capabilities are grouped into Topics.
Larger organizations may have a team associated with each facing role, while smaller organizations may have just a few people who cover these different roles. In filling out the assessment tool, you will likely want to involve people who work in the different roles; they can work to fill out their respective section of the assessment.
Facing Area |
Description |
|---|---|
Researcher- |
Includes research computing and data staffing, outreach, and advanced support, as well as support in the management of the research lifecycle. |
Data-Facing Topics |
Includes data creation; data discovery and collection; data analysis and visualization; research data curation, storage, backup, and transfer; and research data policy compliance. |
Software- Facing Topics |
Includes software package management, research software development, research software optimization or troubleshooting, workflow engineering, containers and cloud computing, securing access to software, and software associated with physical specimens. |
Systems- Facing Topics |
Includes infrastructure systems, systems operations, and systems security and compliance. |
Strategy and Policy-Facing Topics |
Includes institutional alignment, culture for research support, funding, and partnerships and engagement with external communities. |
Table 1 - Description and examples for the Five Facings
Local Priority
Users of the assessment tool can optionally mark each capability as a priority for their organization. This can be used, e.g., to mark items they want to address as part of strategic planning. Priority values range from 1 to 99 (where 1 is the top priority).
These Local Priority values have no impact on the calculated coverage, however they may provide an indication of where RCD support organizations see challenges or opportunities and provide an additional lens on the state of RCD support across the community.
Useful Tools and Features in the Data Viewer
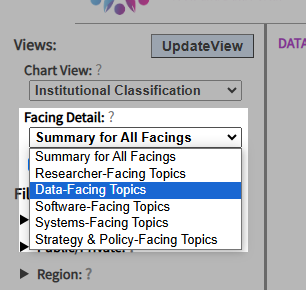
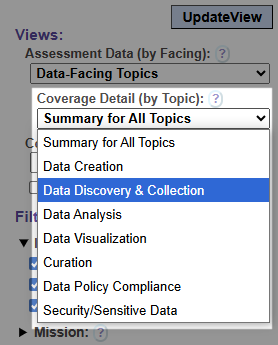
Choose the granularity of the view: Select Summary for All Facings for a high-level overview of capabilities. Select an individual Facing to see summary data for each Topic in that Facing:
Benchmarking support: Check the Benchmark my Data option as shown in the image below to enable an overlay of your institution's coverage on any of the Capabilities Data graphs.
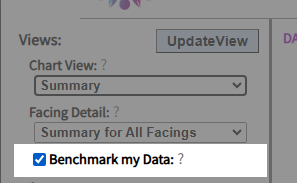
Note: This option will only be shown if you are logged in and your institution is a current Contributor
(i.e., an institution that completed an assessment within the last three calendar
years: 2023 through 2026).
See also the See the Step-by-Step example of benchmarking
for your Institution in the Quick Start Guide.
Share a visualization: If you want to share a visualization with your colleagues, click the link below each visualization. This will create an email with the link in the body. Note: for benchmarking visualizations, users with whom you share a link will have to login to the portal to ensure they have rights to view the benchmarking data.
Download your visualization as an image: If you want to use a particular visualization in a report or presentation, you can download an image of the view using the tools just above the upper-right hand corner of the graph, as in the image excerpt from the graph widget below:
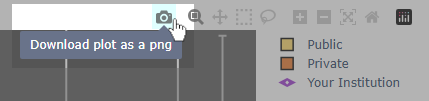
- You can adjust the size of the graph using the View Options->Graph Scale control. Choosing the Small or Medium size may produce a better result that resizing the downloaded image, for some visualizations.
Things of note in the user interface:
- The graph titles indicate how many institutions are in the filtered set.
- In the Capabilities Data graphs, error bars show one standard deviation in the associated data, and indicate the variance among the represented institutions. In smaller Capabilities Data graphs these error bars may partially obscure the rest of the graph; you can hide the error bars by unchecking the View Options->Show Error bars control.
- The filters can be combined in many different ways to get a particular set of institutions.
- Filters are hidden when they do not apply to a given Compare By view. For example, if you select the Public/Private option for Compare By view, the filter for Public/Private will be hidden.
- If there are too few institutions in the filtered set to reasonably represent the defined sub-community, no results will be shown (and a message to this effect will be displayed). This also ensures that institutional data is only shown in aggregate.
- If you want to understand the institutions represented in the dataset, use the Community Demographics section of the data viewer to see the distribution of represented institutions across different metadata types.
Appendix I: Full Feature List and Notes
The Data Viewer has three main areas of functionality:
- Community Demographics
- Capabilities Data and Benchmarking
- Priorities Data (coming in a future release)
Each of these shares some common functionality to filter and control the visualizations.
Community Demographics provides graphical displays of Information about the institutions in the dataset, including:
- A Map View showing the geographical distribution of Users/Contributors. Note that the current map is limited to North American institutions.
- A series of Compare By views showing institutions by different aspects of Institutional Metadata (as described above in the section on Institutional metadata).
- A Scatter Plot showing the considerable variation across the Contributor community.
Capabilities Data and Benchmarking provides graphical displays of Capabilities Model Assessment Data in the Community Dataset, and (for users affiliated with current Contributors) the ability to benchmark assessment results relative to others in the Community Dataset.
A simple checkbox allows the user to overlay an indicator of their institution's coverage levels
on any of the Capabilities Data graphs to compare their results to the community (or a subset thereof).
To use this feature, users must be logged in and affiliated to an institution
that is a current Contributor
(i.e., an institution that completed an assessment within the last three calendar
years: 2023 through 2026).
The benchmarking views can include multiple assessments from an institution; the three most recent assessments will be shown.
See the
Quick Start Guide for a
Step-by-Step example of benchmarking for your Institution.
Three levels of detail are provided:
- Summary Facing averages: overall averages for the community (all Contributors or as filtered by the user) for each Facing.
- Topic-level data for each Facing: users can select a Facing and see the averages for those included Topics.
- Capability-level data for each Topic: users can select a Topic within a Facing and see the averages for each associated capability.
Note: Only users affiliated with an institution that is a current Contributor (i.e., an institution that completed an assessment within the last three calendar years: 2023 through 2026) have access to capability-level data.
A series of visualization types are provided:
- Summary For All Institutions: overall averages for the community (all Contributors or as filtered by the user).
- Comparison by Institutional Classification
- Comparison by Mission
- Comparison by Public/Private
- Comparison by EPSCoR Status
- Comparison by Minority-Serving Status
- Comparison by Organizational Model (centralized, federated, etc.)
- Comparison by Reporting Structure (IT/CIO, VPR, Dean, etc.)
Common functionality to filter data:
For each of the visualizations, users can filter the data to define and explore data about specific sub-communities. The full set of filters is described below, although not all filters are relevant to a given view (and will be hidden in those views).
- Population: to view data for all Users or only for Contributors (see Institutional Populations above). Users select one population to view. Note: This does not apply to the Capabilities Data and Benchmarking functionality since that only presents data from Contributors.
- Institutional Classification (simplified): Given the range of Contributors, this is currently constrained to R1, R2, and Other Academic institutions (i.e., all academic institutions that are not R1 or R2 institutions; excludes those in the “Other” and “Unknown” classifications). Users can select one or more values.
- Institutional Mission: as described above. Users can select one or more values.
- Public/Private: as described above. Users can select one or both values.
- Region: Based on the IPEDS regions, plus two additional regions: Canada and International (see Appendix II for details). Users can select one or more regions.
- Size (total number of students): in ranges defined in the IPEDS dataset. Users can select one or more values.
- Minority-Serving Status (simplified): Given the current range of Contributors, this is constrained to HBCU, HSI, Other MSI and Not Minority Serving. Users can select one or more values.
- Year: Reflects the year in which an institution profile was created (for “All Users”) or the year in which an assessment was submitted (for “Contributors”). Users can select one or more years.
- Research Expenditures Users can specify one or both of a minimum and maximum amount for
research expenditures (in millions of dollars):
- If only a minimum value is specified it will exclude institutions below the specified minimum amount.
- If only a maximum value is specified it will exclude institutions above the specified maximum amount.
- If both values are specified only institutions within the range are included.
Filters can be combined so that users can, for example, filter the view to include only Public institutions in EPSCoR jurisdictions with research expenditures under $200M.
If the specified filter(s) define a set of institutions fewer than five (5), no results will be shown. This is done to preclude incidentally (re-)identifying contributing institutions.
Note that filters are adjusted depending on the visualization chosen, since it makes no sense e.g., to filter on Public/Private if the user has selected a comparison by Public/Private status.
Common functionality to adjust visualizations:
- Adjust the size of the graph using the View Options->Graph Scale control. Choosing the Small or Medium size may produce a better result that resizing the downloaded image, for some visualizations.
- Hide the error bars: Especially for smaller Capabilities Data graphs, the error bars that indicate the variance in the data can partially obscure the rest of the graph; you can hide the error bars by unchecking the View Options->Show Error bars control.
- The graphing widget also has several built in controls to zoom in or out, etc. When you hover over the visualization, a small toolbar appears in the upper right. In particular, these controls include a link to generate and download an image of the current visualization.
Sharing a visualization: Once you have defined a view of interest that you would like to share, you can just copy/paste the browser URL to bookmark a view and/or to share with colleagues. Note: if the view includes benchmarking data, users with whom you share a view will have to login to the portal to ensure they have rights to view the benchmarking data.
Benchmarking institutional coverage:
In addition to the display of community data, a user can choose to overlay values from an approved assessment for their institution to benchmark their capabilities coverage relative to a filtered set of peers. A user can benchmark at the summary (Facings) level, or drill down to benchmark on the Topics in each Facing, or even individual capabilities in a given Topic.
If an institution has completed more than one assessment, the most recent three assessments are shown as overlays. Users can click on the legend labels for each year to hide any of these as desired.
If an institution chooses to complete either an Essentials or Chart-YourOwn-Journey assessment, the benchmarking views will filter the community dataset to reflect only those capabilities included in the institution's assessment. If an institution has completed more than one assessment, the most recent assessment will be used as the basis for filtering the community data (as well as any prior assessments for the institution).
In order to use the benchmarking functionality, a user must be logged in and must be affiliated to an institution that is a current Contributor (i.e., an institution that completed an assessment within the last three calendar years: 2023 through 2026).
Appendix II: Region Definitions
We use the IPEDS regions as defined here: https://nces.ed.gov/ipeds/search/viewtable?tableId=35945 and add two other regions: "Canada" (all provinces and territories) and "International" (for institutions in countries other than the U.S. and Canada).
We do not currently have Users or Contributors from the service academies*, and so do not currently include that IPEDS "region" in the interface.
New England region:
Mid East region:
Great Lakes region:
|
Plains region:
Southeast region:
Southwest region:
|
Rocky Mountains region:
Far West region:
Other U.S. jurisdictions:
|
* U.S. service academies include the U.S. Naval Academy, the U.S. Military Academy, the U.S. Coast Guard Academy, the U.S. Air Force Academy, and the U.S. Merchant Marine Academy.
Footnotes
1 For more on the model, see the Introduction and Guide to Use.
2 IPEDS is the Integrated Postsecondary Education Data System. It is a system of interrelated surveys conducted annually by the U.S. Department of Education’s National Center for Education Statistics (NCES). https://nces.ed.gov/ipeds/.
3 Carnegie Classification of Institutions of Higher Education, https://carnegieclassifications.acenet.edu/
4 This simple taxonomy is based upon ECAR research by Bramanet al. (2006). IT Engagement in Research: A Baseline Study. ECAR. https://www.academia.edu/4420620/IT_Engagement_in_Research_A_Baseline_Study
5 See https://new.nsf.gov/funding/initiatives/epscor/epscor-criteria-eligibility for more information.
6 Drawn from the FY 2023 Eligibility Index: https://www2.ed.gov/about/offices/list/ope/idues/eligibility.html.
7 For more about the roles associated with these areas, see the initial draft of a “Research Computing and Data Professionals Job Elements and Career Guide”, available at: https://carcc.org/wp-content/uploads/2019/01/CI-Professionalization-Job-Families-and-Career-Guide.pdf.